The Matrix That Isn't
Being invited to offer a tutorial on the MATLAB and Gnu Octave matrix languages, for cyber security specialists, prompted me to revisit a question that has bothered me for some time.
In cyber security, as in many other fields, a ‘Risk Matrix’
is a table of likelihood versus severity, into whose boxes one places various
risk events. Likelihood times severity gives a useful metric for the ‘likely
severity’ – called ‘impact’ - so we can focus our attention on the most likely
and severe events.
|
Likelihood |
|||
|
Severity |
Low likelihood |
Medium likelihood |
High likelihood |
|
High severity |
High severity |
High severity |
|
|
Low likelihood |
Medium likelihood |
High likelihood |
|
|
Medium severity |
Medium severity |
Medium severity |
|
|
Low likelihood |
Medium likelihood |
High likelihood |
|
|
Low severity |
Low severity |
Low severity |
|
Figure 1: Conventional Risk Matrix
The idea is to place events in their relevant likelihood-severity
box, so in the example table those events that end up in the top right corner
are highly likely and highly severe, so best avoided.
The problem with the Risk Matrix is that it isn’t really a
matrix.
Well, it IS a matrix in the most general sense – a table
with entries in its boxes – but it isn’t a very useful one in the mathematical
sense.
Let’s be clear: a matrix can contain anything at all in its
boxes: symbols, numbers, text, images, anything. But we don’t have readily
accessible – and more importantly standardised – tools available to work with
arbitrary matrices so we tend to stick to ones that have numbers, which give us
the opportunity to leverage Matrix Arithmetic. So let’s assign numeric
likelihoods and severities. I’m going with a statistician’s model - a range
from 0 (no likelihood or severity) to 1 (total meltdown) – with, say, five
levels: ‘very low’ being 0.2 and ‘very high’ being 0.8 and even spacing in between
(this is a linear scale):
|
very low |
low |
medium |
high |
very high |
|
0.1 |
0.3 |
0.5 |
0.7 |
0.9 |
Figure 2: Likelihood and severity numeric ranges
The conventional Risk Matrix multiplies likelihood by
severity to calculate impact:
|
Likelihood |
0.1 |
0.3 |
0.5 |
0.7 |
0.9 |
||
|
Severity |
0.9 |
0.09 |
0.27 |
0.45 |
0.63 |
0.81 |
|
|
0.7 |
0.07 |
0.21 |
0.35 |
0.49 |
0.63 |
||
|
0.5 |
0.05 |
0.15 |
0.25 |
0.35 |
0.45 |
||
|
0.3 |
0.03 |
0.09 |
0.15 |
0.21 |
0.27 |
||
|
0.1 |
0.01 |
0.03 |
0.05 |
0.07 |
0.09 |
Figure 3: Conventional Risk Matrix with impact
Which actually adds no new information: but because I am
using a matrix programming language, I can at least use a nice ‘surface’ plot
to visualize this Risk Matrix:
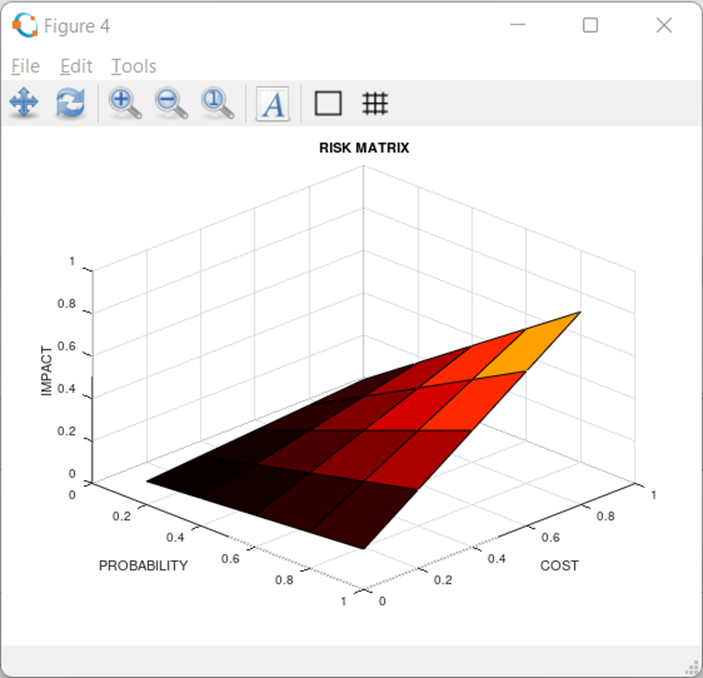
Figure 4: Conventional Risk Matrix as a surface plot
(A surface plot shows height as a value against two
dimensions: in this case the height is impact, the two dimensions are
likelihood and severity).
The conventional Risk Matrix is problematic because its ‘impact’
is redundant – we already know it because we know both likelihood and severity –
so it doesn’t really add any insight beyond ‘look at the high likelihood high severity
corner’.
The conventional Risk Matrix is doubly problematic, in fact,
because a matrix has rows numbered downwards, starting at 1 with the row number
increasing as we go down, whereas the Risk Matrix typically has its vertical
axis (severity or likelihood depending how you arrange it..) going up as you go
… well, ‘up’ … so a Risk Matrix is upside down compared to a mathematical
matrix. I will use mathematical matrices from now on.
To make a more meaningful Risk Matrix we might, for example,
count the number of events that fall into a given impact cell of the Risk
Matrix. Note here that an ‘event’ can be anything that we decide it to be:
breach of confidentiality on a customer database, physical destruction of a
disk drive, stealing of invoice details to use in a finance scam – anything that
matters to us can be an ‘event’ – and we will come back to this later. But for
now, let’s start something readily identifiable, well documented, and easily
seen as relevant to cyber-security: cyber-attacks. An attack being something an
adversary does to exploit a weakness in cyber security.
A useful resource, for instance, is CAPEC™ - Common Attack
Pattern Enumeration and Classification,
– which is a table of cyber ‘Attack Patterns’: a sort of
dictionary of common ways in which cyber resources can be attacked. Here it is
imported into Octave as a matrix:

Figure 5: CAPEC Common Attack pattern Enumeration And
Classification
There are currently 546 lines of attack – each is held in
one row of the matrix. Many of the entries are text, and only some of them use
standard codes that we can look up and interpret automatically, but at least
some are susceptible to automated analysis.
CAPEC lists against each attack its likelihood and severity:
|
'ID |
Name |
… |
Likelihood Of Attack |
Typical Severity |
|
1 |
Accessing Functionality Not Properly Constrained
by ACLs |
… |
High |
High |
|
10 |
Buffer Overflow via Environment Variables |
… |
High |
High |
|
100 |
Overflow Buffers |
… |
High |
Very High |
|
101 |
Server Side Include (SSI) Injection |
… |
High |
High |
Figure 6: CAPEC database with likelihood and severity
Unfortunately, CAPEC – as with many cyber security resources
– uses words rather than numbers for things that ought to be numeric. So, our
first step is to convert text strings to numeric values – trivial but
surprisingly annoying. (Guys, please for the sake of my stress levels, provide
me with numbers for things that can be numeric…).
Then, we can make a matrix – call it an Impact Matrix - with
four columns: one for the attack ID, then one each for likelihood, severity and
impact for each attack:

Figure 7: Impact Matrix
It’s now quite easy to do things like count the number of
attacks that fall into each cell of the conventional Risk Matrix, or calculate
the ‘average’ impact over all attacks:

Figure 8: Count and average impact Risk Matrices
And, since I am using a matrix language that offers many ways
to visualize matrices, I can show each of these in different ways:

Figure 9: Risk matrices visualized in different ways
Here I have displayed both metrics in three ways: as a 3D
scatter plot (these are most helpful if you rotate them which help you see
where the scatter points fall in 3D space); as a surface; and as an image
(which is close to how the conventional Risk Matrix is usually displayed).
You might gain some insights from these: for example, it
seems that most CAPEC Attack Paths fall into mid Likelihood and Severity, and
so do their averages – but one might expect that, as the greatest number of
paths are quite unlikely and not very severe and may overly weight the average
anyway. Another insight is that grading things as ‘low’, ‘medium’ and ‘high’
isn’t all that helpful in doing actual arithmetic because the visualizations
are very granular. But let’s see what else might be useful from the CAPEC
Matrix.
Attacks, though interesting, don’t tell much of the cyber
security story: they are ways in which an adversary might attempt to do
something that might cause harm, but they don’t say what that harm might be. But
CAPEC, in common with other cyber security databases, does list the
Consequences of an attack. Consequences are in some sense things that matter –
categories of harm – so if we are more interested in the risks of certain kinds
of harm than in details of specific attacks, they offer a helpful categorisation.
CAPEC Consequences fall into six categories:
|
Consequences |
|
::SCOPE:Confidentiality:SCOPE:Access
Control:SCOPE:AuthorizationTECHNICAL IMPACT:Gain Privileges:: |
|
::SCOPE:AvailabilityTECHNICAL IMPACT:Unreliable
Execution::SCOPE:Confidentiality:SCOPE:Integrity:SCOPE:AvailabilityTECHNICAL
IMPACT:Execute Unauthorized Commands:NOTE:Confidentiality Integrity
Availability Execute Unauthorized Commands Run Arbitrary
Code::SCOPE:ConfidentialityTECHNICAL IMPACT:Read
Data::SCOPE:IntegrityTECHNICAL IMPACT:Modify Data::SCOPE:Confidentiality:SCOPE:Access
Control:SCOPE:AuthorizationTECHNICAL IMPACT:Gain Privileges:: |
|
::SCOPE:AvailabilityTECHNICAL IMPACT:Unreliable Execution::SCOPE:Confidentiality:SCOPE:Integrity:SCOPE:AvailabilityTECHNICAL
IMPACT:Execute Unauthorized Commands:NOTE:Confidentiality Integrity
Availability Execute Unauthorized Commands Run Arbitrary
Code::SCOPE:Confidentiality:SCOPE:Access Control:SCOPE:AuthorizationTECHNICAL
IMPACT:Gain Privileges:: |
|
::SCOPE:ConfidentialityTECHNICAL IMPACT:Read
Data::SCOPE:Confidentiality:SCOPE:Integrity:SCOPE:AvailabilityTECHNICAL
IMPACT:Execute Unauthorized Commands:NOTE:Confidentiality Integrity
Availability Execute Unauthorized Commands Run Arbitrary Code:: |
|
::SCOPE:Confidentiality:SCOPE:Access
Control:SCOPE:AuthorizationTECHNICAL IMPACT:Gain
Privileges::SCOPE:IntegrityTECHNICAL IMPACT:Modify
Data::SCOPE:ConfidentialityTECHNICAL IMPACT:Read Data::SCOPE:AvailabilityTECHNICAL
IMPACT:Unreliable Execution:: |
|
::SCOPE:Confidentiality:SCOPE:Access
Control:SCOPE:AuthorizationTECHNICAL IMPACT:Gain
Privileges::SCOPE:IntegrityTECHNICAL IMPACT:Modify
Data::SCOPE:ConfidentialityTECHNICAL IMPACT:Read
Data::SCOPE:AvailabilityTECHNICAL IMPACT:Unreliable Execution:: |
|
::SCOPE:IntegrityTECHNICAL IMPACT:Modify
Data::SCOPE:ConfidentialityTECHNICAL IMPACT:Read
Data::SCOPE:Confidentiality:SCOPE:Access Control:SCOPE:AuthorizationTECHNICAL
IMPACT:Gain Privileges::SCOPE:Confidentiality:SCOPE:Integrity:SCOPE:AvailabilityTECHNICAL
IMPACT:Execute Unauthorized Commands:NOTE:Confidentiality Integrity
Availability Execute Unauthorized Commands Run Arbitrary Code:: |
Figure 10: CAPEC Consequences
Sadly (and this is becoming a depressingly familiar pattern)
this is all encoded as text strings – actually XML file format – but we can place
them into six categories (the first three of which match the traditional ‘CIA
triad’):
1.
Confidentiality
2.
Integrity
3.
Availability
4.
Access Control
5.
Authorization
6.
Authentication
and from them we can form a Consequences Matrix with six columns
(one for each of the Consequences) and 546 rows (one for each CAPEC attack):

Figure 11: CAPEC Consequences Matrix
Here I have weighted each Consequence with the attack’s impact.
This is a useful matrix: it shows, for each attack, the
impact on each of the six CAPEC Consequences. If we added up all the impacts in
each column we would have an indication, for each Consequence, of the overall
impact of all CAPEC cyber attacks, weighted for likelihood and severity:

Figure 12: Impact of all CAPEC attacks
for each CAPEC Consequence
This isn’t all that useful, though: it isn’t selective of
attacks, it just assumes all can happen. Not an unreasonable assumption,
actually, but the CAPEC database is flawed – as are most cyber security
listings – because it lists EVERYTHING that might happen, even though in most
circumstances most attacks won’t. If the likelihood and severity were reliable
(I don’t know if they are or not..) and not so crude, then this might be a
useful step, but I don’t think it is. And this plot just shows the impact of
everything without saying on what: Confidentiality (column 1) is the greatest
risk but confidentiality of what – the customer database, the bank account
details, private messages?
Let’s think about impacts, not just overall but selectively.
Ideally, I would choose some value or asset that mattered, and say which
attacks might harm that. I could do that by saying how likely it is that each
attack might harm that particular value or asset: a ‘filter’ that selects
attacks and so groups their impacts. But I’m working with available dats, not
making it up myself, so I will go with something CAPEC already offers:
Mechanisms Of Attack.
CAPEC defines ‘Mechanisms Of Attack’ - for example “Engage
in Deceptive Interactions” or “Subvert Access Control” or “Inject Unexpected
Items” are Mechanisms – by specifying groups of attacks that fall into that
category. Each Mechanism Of Attack is a filter, selecting attacks. There are
nine Mechanisms Of Attack.
Note that I could generate a Risk Matrix for each Mechanism
Of Attack: and that would be a useful thing to do but I want to do something a it
more clever.
We can define a new matrix with nine columns - one for each
Mechanism Of Attack – and 546 rows, one for each attack. Like the Consequences
Matrix this MOA Matrix lists, for each attack, how much it contributes risk to each
MOA. For a mechanism Of Attack the filter is either r off or on – the attack is
either in the MOA or not – but for other views we might allocate some weighting
number.
Now we have two matrices: The Consequences Matrix, of 546
rows and 6 columns; and the MOA Matrix, of 546 rows and 9 columns. To work out
the total impact for each Consequence for each MOA I need to run down the
respective columns, multiplying the pairs of elements from each matrix
together, then add them all up to form an overall impact. Handily, this is
exactly what mathematical Matrix Multiplication does (strictly this is a Matrix
Cross product): creating a new matrix of 9 rows (Mechanisms Of Attack) and 6
columns (Consequences):

Figure 13: Consequences of Mechanisms
Of Attack
This shows, for each intersection, the impact (risk..) to that
Consequence, due to that Mechanism Of Attack. Which is, in fact, a Risk Matrix.
And we can visualize it nicely too:

Figure 14: Risk Matrix - Consequences
for each Mechanism Of Attack
and I think that is rather neat.
Comments
Post a Comment